8. You shall not steal.
(C)Copyright 2002 by Carl Drews
Last update: February 25, 2003
This web page describes the methodology and data sources used to measure the behavior of the people of the United States in following the Eighth Commandment.
Contents: Index Value, Graph, Methodology, Data Sources, Calculations
Current Value: +0.3029 lives per thousand people.
This index was last updated on October 19, 2003.
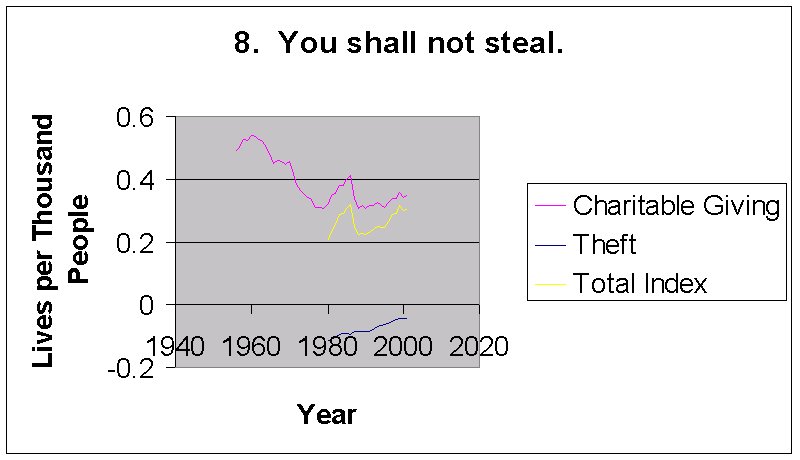
Stealing is taking what is not yours. That's the negative component of this commandment. The positive component is giving away what is yours - charitable giving. This commandment is comparatively simple to measure.
When I first investigated this commandment in November 2002, I looked at FBI reports, specifically the Crime Index Offenses Reported. "An estimated monetary value of $17.1 billion in stolen property was reported in 2001. Thefts of motor vehicles accounted for the greatest monetary loss, followed by thefts of jewelry and precious metals; currency, notes, etc.; and televisions, radios, stereos, etc." So we have a figure of $17.1 billion in total theft for 2001. That's the negative component.
The National Center for Charitable Statistics publishes all kinds of data on giving to charities. They get their information from the Internal Revenue Service, which collects the data from tax returns. The NCCS report is titled "Data on 2000 Itemized Charitable Contributions from the IRS Statistics of Income Bulletin". According to this report, Americans gave $136,654,153,000 in itemized charitable contributions in the year 2000.
When I saw this figure I was absolutely stunned! Do I have the decimal point in the right place? Yep, that's 136.6 billion dollars! Wow! That's a lot of money! I was also very happy. Americans steal $17.1 billion per year, but we give away $136.6 billion. Giving outnumbers stealing by a factor of 8! That's fantastic!!!
This is the first commandment that I measured. I collected the data and created the first graph in February 2003. It was quite a thrill to see the snaky line arising from the data for the very first time. I was looking at a graph that no human being had ever seen before! I could see distinct periods of American history reflected in the graph. I also realized how much I wanted the graph to go up, to show that morality in America is improving. This graph does not show that; our charitable giving peaked in 1960 and we haven't been back to that level since. Sigh... Well, those are the numbers and I'm not allowed to change them. I'm committed to finding out the truth whereever it may lead.
The data on charitable giving comes from the Statistics of Income bulletins published by the Internal Revenue Service. It's unfortunate that we don't have figures for the years 1927-1938 and 1947-1955. Those are interesting periods of American history. I performed a simple linear interpolation for the missing years that have data in adjacent years; except for 1940, when there was too big of a jump to interpolate safely.
|
Year |
Adjusted Gross Income on Tax Return (billions of $). 1913-1943 is Net Income. |
Charitable Deductions (thousands of $) |
|
1900 |
|
|
|
1901 |
|
|
|
1902 |
|
|
|
1903 |
|
|
|
1904 |
|
|
|
1905 |
|
|
|
1906 |
|
|
|
1907 |
|
|
|
1908 |
|
|
|
1909 |
|
|
|
1910 |
|
|
|
1911 |
|
|
|
1912 |
|
|
|
1913 |
3.900000 |
|
|
1914 |
4.000000 |
|
|
1915 |
4.600000 |
|
|
1916 |
6.298578 |
|
|
1917 |
13.652383 |
245,080 |
|
1918 |
15.924639 |
|
|
1919 |
19.859491 |
|
|
1920 |
23.735629 |
387,290 |
|
1921 |
19.577213 |
|
|
1922 |
21.336213 |
425,218 |
|
1923 |
24.777466 |
534,797 |
|
1924 |
25.656153 |
533,168 |
|
1925 |
21.894576 |
441,590 |
|
1926 |
21.958506 |
484,205 |
|
1927 |
22.545091 |
|
|
1928 |
25.226327 |
|
|
1929 |
24.800736 |
|
|
1930 |
18.118635 |
|
|
1931 |
13.604996 |
|
|
1932 |
11.655909 |
|
|
1933 |
11.008638 |
|
|
1934 |
12.796802 |
|
|
1935 |
14.909812 |
|
|
1936 |
19.240110 |
|
|
1937 |
21.238574 |
|
|
1938 |
18.897374 |
|
|
1939 |
23.191871 |
498,901 |
|
1940 |
36.588546 |
|
|
1941 |
58.868025 |
1,002,187 |
|
1942 |
78.889362 |
1,450,144 |
|
1943 |
99.585627 |
1,836,006 |
|
1944 |
116.714736 |
1,257,948 |
|
1945 |
120.301131 |
1,450,011 |
|
1946 |
134.330006 |
1,638,982 |
|
1947 |
150.295275 |
|
|
1948 |
164.173861 |
|
|
1949 |
161.373205 |
|
|
1950 |
179.100000 |
|
|
1951 |
202.300000 |
|
|
1952 |
215.300000 |
|
|
1953 |
228.700000 |
|
|
1954 |
229.200000 |
|
|
1955 |
248.500000 |
|
|
1956 |
267.700000 |
4,877,793 |
|
1957 |
280.300000 |
|
|
1958 |
281.200000 |
5,693,836 |
|
1959 |
305.100000 |
|
|
1960 |
315.500000 |
6,750,326 |
|
1961 |
329.900000 |
|
|
1962 |
348.700000 |
7,516,088 |
|
1963 |
368.800000 |
|
|
1964 |
396.700000 |
8,326,986 |
|
1965 |
429.200000 |
|
|
1966 |
468.500000 |
9,122,491 |
|
1967 |
504.800000 |
|
|
1968 |
554.400000 |
11,138,925 |
|
1969 |
603.500000 |
|
|
1970 |
631.700000 |
12,892,732 |
|
1971 |
673.600000 |
|
|
1972 |
746.000000 |
13,208,000 |
|
1973 |
827.100000 |
13,895,720 |
|
1974 |
905.500000 |
14,851,273 |
|
1975 |
947.800000 |
15,393,331 |
|
1976 |
1,053.900000 |
16,792,387 |
|
1977 |
1,158.500000 |
17,266,462 |
|
1978 |
1,302.400000 |
19,691,249 |
|
1979 |
1,465.400000 |
22,210,838 |
|
1980 |
1,613.700000 |
25,809,608 |
|
1981 |
1,772.600000 |
30,800,722 |
|
1982 |
1,852.100000 |
33,471,694 |
|
1983 |
1,942.600000 |
37,677,955 |
|
1984 |
2,139.900000 |
42,119,812 |
|
1985 |
2,306.000000 |
47,962,848 |
|
1986 |
2,481.700000 |
53,815,979 |
|
1987 |
2,773.800000 |
49,623,907 |
|
1988 |
3,083.000000 |
50,949,273 |
|
1989 |
3,256.400000 |
55,459,205 |
|
1990 |
3,405.400000 |
57,242,757 |
|
1991 |
3,464.500000 |
60,575,848 |
|
1992 |
3,629.100000 |
63,843,281 |
|
1993 |
3,723.300000 |
68,354,293 |
|
1994 |
3,907.500000 |
70,544,542 |
|
1995 |
4,189.400000 |
74,991,519 |
|
1996 |
4,536.000000 |
86,159,305 |
|
1997 |
4,969.900000 |
99,191,962 |
|
1998 |
5,416.000000 |
109,240,078 |
|
1999 |
5,855.500000 |
125,798,548 |
|
2000 |
6,330.600000 |
133,605,239 |
|
2001 |
6,181.889543 |
134,043,582 |
The Federal Bureau of Investigation publishes information on the number of crimes committed, but I wanted to get some idea of the value of goods and money stolen. I wrote to the Programs Support Division, Criminal Justice Information Services Division, Federal Bureau of Investigation; and they kindly sent me an unpublished table of Estimated Crime Value for the years 1980-2001.
|
Year |
Robberies |
Average Value |
Dollar Loss |
Burglaries |
Average Value |
Dollar Loss |
Larceny-thefts |
Average Value |
Dollar Loss |
Motor Vehicle thefts |
Average Value |
Dollar Loss |
Total Dollar Loss |
|
1980 |
565,840 |
$607 |
$343,464,880 |
3,795,200 |
$882 |
$3,347,366,400 |
7,136,900 |
$307 |
$2,191,028,300 |
1,131,700 |
$2,879 |
$3,258,164,300 |
$9,140,023,880 |
|
1981 |
592,910 |
$665 |
$394,285,150 |
3,779,700 |
$924 |
$3,492,442,800 |
7,194,400 |
$340 |
$2,446,096,000 |
1,087,800 |
$3,173 |
$3,451,589,400 |
$9,784,413,350 |
|
1982 |
553,130 |
$632 |
$349,578,160 |
3,447,100 |
$880 |
$3,033,448,000 |
7,142,500 |
$340 |
$2,428,450,000 |
1,062,400 |
$3,545 |
$3,766,208,000 |
$9,577,684,160 |
|
1983 |
506,570 |
$645 |
$326,737,650 |
3,129,900 |
$860 |
$2,691,714,000 |
6,712,800 |
$348 |
$2,336,054,400 |
1,007,900 |
$3,934 |
$3,965,078,600 |
$9,319,584,650 |
|
1984 |
485,010 |
$609 |
$295,371,090 |
2,984,400 |
$900 |
$2,685,960,000 |
6,591,900 |
$376 |
$2,478,554,400 |
1,032,200 |
$4,418 |
$4,560,259,600 |
$10,020,145,090 |
|
1985 |
497,870 |
$628 |
$312,662,360 |
3,073,300 |
$953 |
$2,928,854,900 |
6,926,400 |
$393 |
$2,722,075,200 |
1,102,900 |
$4,619 |
$5,094,295,100 |
$11,057,887,560 |
|
1986 |
542,780 |
$596 |
$323,496,880 |
3,241,400 |
$960 |
$3,111,744,000 |
7,257,200 |
$400 |
$2,902,880,000 |
1,224,100 |
$4,888 |
$5,983,400,800 |
$12,321,521,680 |
|
1987 |
517,700 |
$631 |
$326,668,700 |
3,236,200 |
$975 |
$3,155,295,000 |
7,499,900 |
$404 |
$3,029,959,600 |
1,288,700 |
$4,964 |
$6,397,106,800 |
$12,909,030,100 |
|
1988 |
542,970 |
$631 |
$342,614,070 |
3,218,100 |
$1,014 |
$3,263,153,400 |
7,705,900 |
$426 |
$3,282,713,400 |
1,432,900 |
$5,117 |
$7,332,149,300 |
$14,220,630,170 |
|
1989 |
578,330 |
$701 |
$405,409,330 |
3,168,200 |
$1,060 |
$3,358,292,000 |
7,872,400 |
$462 |
$3,637,048,800 |
1,564,800 |
$5,222 |
$8,171,385,600 |
$15,572,135,730 |
|
1990 |
639,270 |
$781 |
$499,269,870 |
3,073,900 |
$1,132 |
$3,479,654,800 |
7,945,700 |
$480 |
$3,813,936,000 |
1,635,900 |
$5,061 |
$8,279,289,900 |
$16,072,150,570 |
|
1991 |
687,730 |
$818 |
$562,563,140 |
3,157,200 |
$1,246 |
$3,933,871,200 |
8,142,200 |
$478 |
$3,891,971,600 |
1,661,700 |
$4,979 |
$8,273,604,300 |
$16,662,010,240 |
|
1992 |
672,480 |
$841 |
$565,555,680 |
2,979,900 |
$1,280 |
$3,814,272,000 |
7,915,200 |
$484 |
$3,830,956,800 |
1,610,800 |
$4,717 |
$7,598,143,600 |
$15,808,928,080 |
|
1993 |
659,870 |
$782 |
$516,018,340 |
2,834,800 |
$1,175 |
$3,330,890,000 |
7,820,900 |
$502 |
$3,926,091,800 |
1,563,100 |
$4,902 |
$7,662,316,200 |
$15,435,316,340 |
|
1994 |
618,950 |
$800 |
$495,160,000 |
2,712,800 |
$1,191 |
$3,230,944,800 |
7,879,800 |
$503 |
$3,963,539,400 |
1,539,300 |
$4,941 |
$7,605,681,300 |
$15,295,325,500 |
|
1995 |
580,510 |
$882 |
$512,009,820 |
2,593,800 |
$1,277 |
$3,312,282,600 |
7,997,700 |
$540 |
$4,318,758,000 |
1,472,400 |
$5,036 |
$7,415,006,400 |
$15,558,056,820 |
|
1996 |
535,590 |
$918 |
$491,671,620 |
2,506,400 |
$1,368 |
$3,428,755,200 |
7,904,700 |
$546 |
$4,315,966,200 |
1,394,200 |
$5,159 |
$7,192,677,800 |
$15,429,070,820 |
|
1997 |
498,530 |
$967 |
$482,078,510 |
2,460,500 |
$1,338 |
$3,292,149,000 |
7,743,800 |
$585 |
$4,530,123,000 |
1,354,200 |
$5,441 |
$7,368,202,200 |
$15,672,552,710 |
|
1998 |
447,190 |
$980 |
$438,246,200 |
2,332,700 |
$1,331 |
$3,104,823,700 |
7,376,300 |
$632 |
$4,661,821,600 |
1,242,800 |
$5,911 |
$7,346,190,800 |
$15,551,082,300 |
|
1999 |
409,380 |
$1,077 |
$440,902,260 |
2,100,700 |
$1,513 |
$3,178,359,100 |
6,955,500 |
$678 |
$4,715,829,000 |
1,152,100 |
$6,118 |
$7,048,547,800 |
$15,383,638,160 |
|
2000 |
407,840 |
$1,127 |
$459,635,680 |
2,049,900 |
$1,458 |
$2,988,754,200 |
6,966,000 |
$727 |
$5,064,282,000 |
1,165,600 |
$6,581 |
$7,670,813,600 |
$16,183,485,480 |
|
2001 |
422,930 |
$1,258 |
$532,045,940 |
2,109,800 |
$1,545 |
$3,259,641,000 |
7,076,200 |
$730 |
$5,165,626,000 |
1,226,500 |
$6,646 |
$8,151,319,000 |
$17,108,631,940 |
This section works through all the adjustments and calculations made, from the original datum through the final index value, so interested readers may follow and verify the methodology used. We will use the year 1986 because it happens to be a high point in the final graph.
According to the Internal Revenue Service, the total amount of charitable deductions claimed by all Americans in 1986 was $53,815,979,000. I take all these "raw" dollar values and immediately adjust them for inflation according to the Consumer Price Index. We obtain Year 2000 dollars as follows:
Charitable deductions in year 2000 dollars = $53,815,979,000 * CPI for 2000 / CPI for 1986
= $53,815,979,000 * 250.8 / 167.3 = $80,675,717,000
Jesus makes an observation about charitable giving in Mark 12: 41-43:
The Widow's Offering
Jesus sat down opposite the place where the offerings were put and watched the crowd putting their money into the temple treasury. Many rich people threw in large amounts. But a poor widow came and put in two very small copper coins, worth only a fraction of a penny. Calling His disciples to Him, Jesus said, "I tell you the truth, this poor widow has put more into the treasury than all the others. They all gave out of their wealth; but she, out of her poverty, put in everything - all she had to live on."
In this case Jesus' observation is easy to put into quantitative practice. We need to adjust the given amount by the income of the giver. This makes sense for the morality index - if Americans' real income goes up a lot and we give only a little bit more, the net result is lower morality, not higher. We need to adjust charitable deductions by the Adjusted Gross Income (AGI). According to the Internal Revenue Service, the total AGI for all Americans in 1986 was $2,481,700,000,000. (At this point it's interesting to note that Americans gave 3.25% of our income in 1986 to charitable causes.) Again, we immediately adjust for inflation.
Adjusted Gross Income in Year 2000 dollars = $2,481,700,000,000 * CPI for 2000 / CPI for 1986
= $2,481,700,000,000 * 250.8 / 167.3 = $3,720,324,925,000
Now we adjust the charitable giving in 1986 by AGI, obtaining the charitable giving for 1986 expressed in dollars of year 2000 income. This is the 1986 charitable giving adjusted for inflation and income.
Giving in dollars of Year 2000 income = $80,675,717,000 * AGI for Year 2000 / AGI for Year 1986
= $80,675,717,000 * $6,330,600,000,000 / $3,720,324,925,000 = $137,279,863,000
The next step is to express that dollar amount in terms of lives. We divide the dollar amount by an average American's lifetime earnings ($1,388,000 in 2000).
1986 Charitable giving expressed in lives = $137,279,863,000 / $1,388,000 per life
= 98,905 lives
The final step here is to express charitable giving in lives per thousand people. We divide by the population of the United States in 1986.
1986 Charitable giving in lives per thousand people = 98,905 lives * 1,000 / 1986 population
= 98,905 * 1,000 / 240,132,887 = 0.411875282
This number is the final positive component of the morality index for the Eighth Commandment. If the number looks small, remember that a human life is worth a lot of money. Expressed back in dollars, a thousand Americans gave (0.411875282 * $1,388,000 =) $571,683 in 1986. That's a nice chunk of change.
Note: It turns out that the two inflation adjustments are numerically redundant; we accomplish the same thing by adjusting to year 2000 income. Nevertheless, the policy of adjusting all "raw" dollar amounts for inflation helps establish a consistent pattern of calculation for all Ten Commandments.
According to the Federal Bureau of Investigation, the total dollar loss for all theft crimes (robbery, burglary, larceny-theft, and motor vehicle theft) in the year 1986 was $12,321,521,680. First we take all these "raw" dollar values and immediately adjust them for inflation according to the Consumer Price Index. We obtain Year 2000 dollars as follows:
Theft in year 2000 dollars = $12,321,521,680 * CPI for 2000 / CPI for 1986
= $12,321,521,680 * 250.8 / 167.3 = $18,471,235,000
It's only fair to adjust theft by income, since we made that same adjustment for charitable giving. Is there a Bible passage to justify making an income adjustment on this side of the equation? Of course there is. See 2 Samuel 12:1-10:
Nathan Rebukes David
The Lord sent [the prophet] Nathan to [King] David. When he came to him, he said, "There were two men in a certain town, one rich and the other poor. The rich man had a very large number of sheep and cattle, but the poor man had nothing except one little ewe lamb he had bought. He raised it, and it grew up with him and his children. It shared his food, drank from his cup and even slept in his arms. It was like a daughter to him."Now a traveler came to the rich man, but the rich man refrained from taking one of his own sheep or cattle to prepare a meal for the traveler who had come to him. Instead, he took the ewe lamb that belonged to the poor man and prepared [cooked] it for the one who had come to him."
David burned with anger against the man and said to Nathan, "As surely as the Lord lives, the man who did this deserves to die! He must pay for that lamb four times over, because he did such a thing and had no pity."
Then Nathan said to David, "You are the man! This is what the Lord, the God of Israel, says: 'I annointed you king over Israel, and I delivered you from the hand of Saul. I gave your master's house to you, and your master's wives into your arms. I gave you the house of Israel and Judah. And if all this had been too little, I would have given you even more. Why did you despise the word of the Lord by doing what is evil in His eyes? You struck down Uriah the Hittite with the sword and took his wife [Bathsheba] to be your own. You killed him with the sword of the Ammonites. Now, therefore, the sword will never depart from your house, because you despised Me and took the wife of Uriah the Hittite to be your own.'"
Nathan's direction to make the income adjustment is not as clear as Jesus' observation, but we can see that King David's actions are even more odious because he took from a man who had so little. Although God hates to see a rich man steal from a poor man, don't forget that all stealing is 100% wrong. (This episode also involves adultery and murder. We'll get to them in the other commandments.)
We adjust the theft in 1986 by Adjusted Gross Income (AGI), obtaining the theft for 1986 expressed in dollars of year 2000 income. This is the 1986 theft adjusted for inflation and income.
Theft in dollars of Year 2000 income = $18,471,235,000 * AGI for Year 2000 / AGI for Year 1986
= $18,471,235,000 * $6,330,600,000,000 / $3,720,324,925,000 = $31,431,125,900
The next step is to express that dollar amount in terms of lives. We divide the dollar amount by an average American's lifetime earnings ($1,388,000 in 2000).
1986 Theft expressed in lives = $31,431,125,900 / $1,388,000 per life
= 22,645 lives
The final step here is to express theft in lives per thousand people. We divide by the population of the United States in 1986.
1986 Theft in lives per thousand people = 22,645 lives * 1,000 / 1986 population
= 22,645 * 1,000 / 240,132,887 = 0.09430155
Now that we have the indexes for charitable giving and theft expressed in the same units, it's a simple matter to add them together to get the final composite index.
1986 Morality Index for Commandment 8 = 1986 Charitable Giving Index - 1986 Theft index
= 0.411875282 - 0.09430155 = 0.3175737
The table below contains the final index values for the Eighth Commandment over several decades. As you can see, the Theft numbers don't kick in until 1980, so we don't really have a valid composite index until that year. However, the positive component is still interesting by itself (see graph at top of page).
|
Year |
Charitable Giving (lives per thousand people) |
Theft (lives per thousand people) |
8. You shall not steal |
|
1956 |
0.492032 |
0 |
0.492032 |
|
1957 |
0.500099 |
0 |
0.500099 |
|
1958 |
0.528081 |
0 |
0.528081 |
|
1959 |
0.523052 |
0 |
0.523052 |
|
1960 |
0.540122 |
0 |
0.540122 |
|
1961 |
0.53687 |
0 |
0.53687 |
|
1962 |
0.527022 |
0 |
0.527022 |
|
1963 |
0.517675 |
0 |
0.517675 |
|
1964 |
0.498921 |
0 |
0.498921 |
|
1965 |
0.477165 |
0 |
0.477165 |
|
1966 |
0.451818 |
0 |
0.451818 |
|
1967 |
0.460629 |
0 |
0.460629 |
|
1968 |
0.456578 |
0 |
0.456578 |
|
1969 |
0.448051 |
0 |
0.448051 |
|
1970 |
0.453968 |
0 |
0.453968 |
|
1971 |
0.425522 |
0 |
0.425522 |
|
1972 |
0.384724 |
0 |
0.384724 |
|
1973 |
0.361601 |
0 |
0.361601 |
|
1974 |
0.349795 |
0 |
0.349795 |
|
1975 |
0.342982 |
0 |
0.342982 |
|
1976 |
0.333305 |
0 |
0.333305 |
|
1977 |
0.308651 |
0 |
0.308651 |
|
1978 |
0.309806 |
0 |
0.309806 |
|
1979 |
0.307167 |
0 |
0.307167 |
|
1980 |
0.32104 |
-0.11369 |
0.207349 |
|
1981 |
0.345373 |
-0.10971 |
0.235659 |
|
1982 |
0.355803 |
-0.10181 |
0.253992 |
|
1983 |
0.378381 |
-0.09359 |
0.284789 |
|
1984 |
0.380679 |
-0.09056 |
0.290117 |
|
1985 |
0.398716 |
-0.09192 |
0.306791 |
|
1986 |
0.411875 |
-0.0943 |
0.317574 |
|
1987 |
0.336773 |
-0.08761 |
0.249166 |
|
1988 |
0.308278 |
-0.08604 |
0.222234 |
|
1989 |
0.314711 |
-0.08837 |
0.226345 |
|
1990 |
0.307326 |
-0.08629 |
0.221038 |
|
1991 |
0.316264 |
-0.08699 |
0.229272 |
|
1992 |
0.314616 |
-0.07791 |
0.236711 |
|
1993 |
0.324818 |
-0.07335 |
0.251469 |
|
1994 |
0.316301 |
-0.06858 |
0.247721 |
|
1995 |
0.31066 |
-0.06445 |
0.246209 |
|
1996 |
0.326636 |
-0.05849 |
0.268143 |
|
1997 |
0.339938 |
-0.05371 |
0.286227 |
|
1998 |
0.340405 |
-0.04846 |
0.291946 |
|
1999 |
0.359333 |
-0.04394 |
0.315391 |
|
2000 |
0.341187 |
-0.04133 |
0.29986 |
|
2001 |
0.347252 |
-0.04432 |
0.302931 |